Bias vs variance: the dartboard view
Bias and variance are two ways a model's predictions go wrong. Picture training the same model many times, each on a fresh data sample. Each dart is one model's prediction for the same input, and the bullseye is the true answer.
2 min read · Lensa ML
- Bias is the gap between the average model's prediction and the true value: how far the average dart lands from the bullseye. Variance is how much the model changes from one training sample to the next: how widely the darts scatter. The gold ring marks each average throw. It sits on the bullseye in the top row and off to one side in the bottom row, where the dashed line to it is the bias. The right column scatters widely.
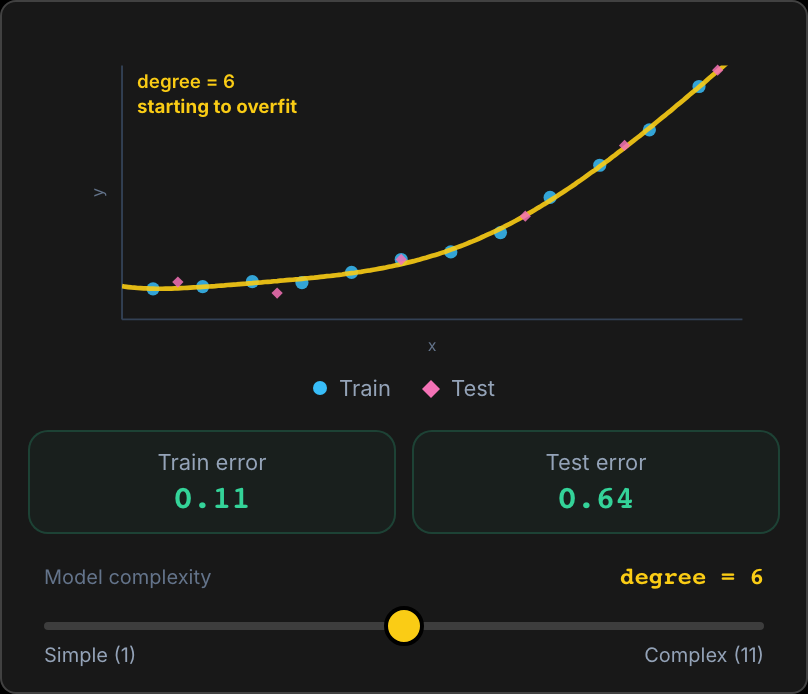
- Training error is a model's error on the data it learned from. Test error is its error on new data. A high-bias model is too simple for the pattern, like a straight line fit to a curve. It underfits, missing the pattern: both errors are high and close together. A high-variance model is flexible enough to chase the noise in its sample. It overfits, memorizing that noise: training error is low and test error much higher. When bias is also high, training error stays high.
- Measure error as the squared gap between prediction and truth, and expected test error splits exactly into three parts: bias² + variance + irreducible noise. The noise is randomness in the data itself, a floor no model can beat. More complex models usually trade higher variance for lower bias, so test error is lowest in between. For the same model, more training data mainly shrinks variance. The dartboard hides one thing: in practice you get one dart and never see the others. A dart's second axis is only for display.
Takeaway
Compare training error with validation error, measured on data kept out of training. If both are high, try a more flexible model or more input variables. If training error is low and validation error much higher, cut variance with more data, regularization (a penalty on large weights) or an average of many models.
Go deeper · interactive
Bias-Variance Tradeoff
Drag the polynomial degree slider and watch fits from five fresh samples pull apart.
Open the explainer